
How to Use AI to Analyze Excel Data: 10+ Tasks You Can Automate

Tram Ta
September 21, 2026

Learn how to use AI to analyze Excel data, from finding trends and outliers to cleaning datasets, creating formulas, comparing results, and generating insights.
Excel spreadsheets can contain valuable business information, but finding useful insights manually can take hours. Large datasets often require filtering, sorting, formulas, comparisons, and repeated calculations before you can understand what the numbers are actually showing.
AI can make many of these tasks faster.
Instead of manually searching through thousands of rows, you can give an AI tool your spreadsheet and ask questions in plain language. Depending on the tool, AI can help identify trends, find unusual values, summarize data, create formulas, and turn raw numbers into understandable insights.
Here are 10+ practical ways to use AI to analyze Excel data.
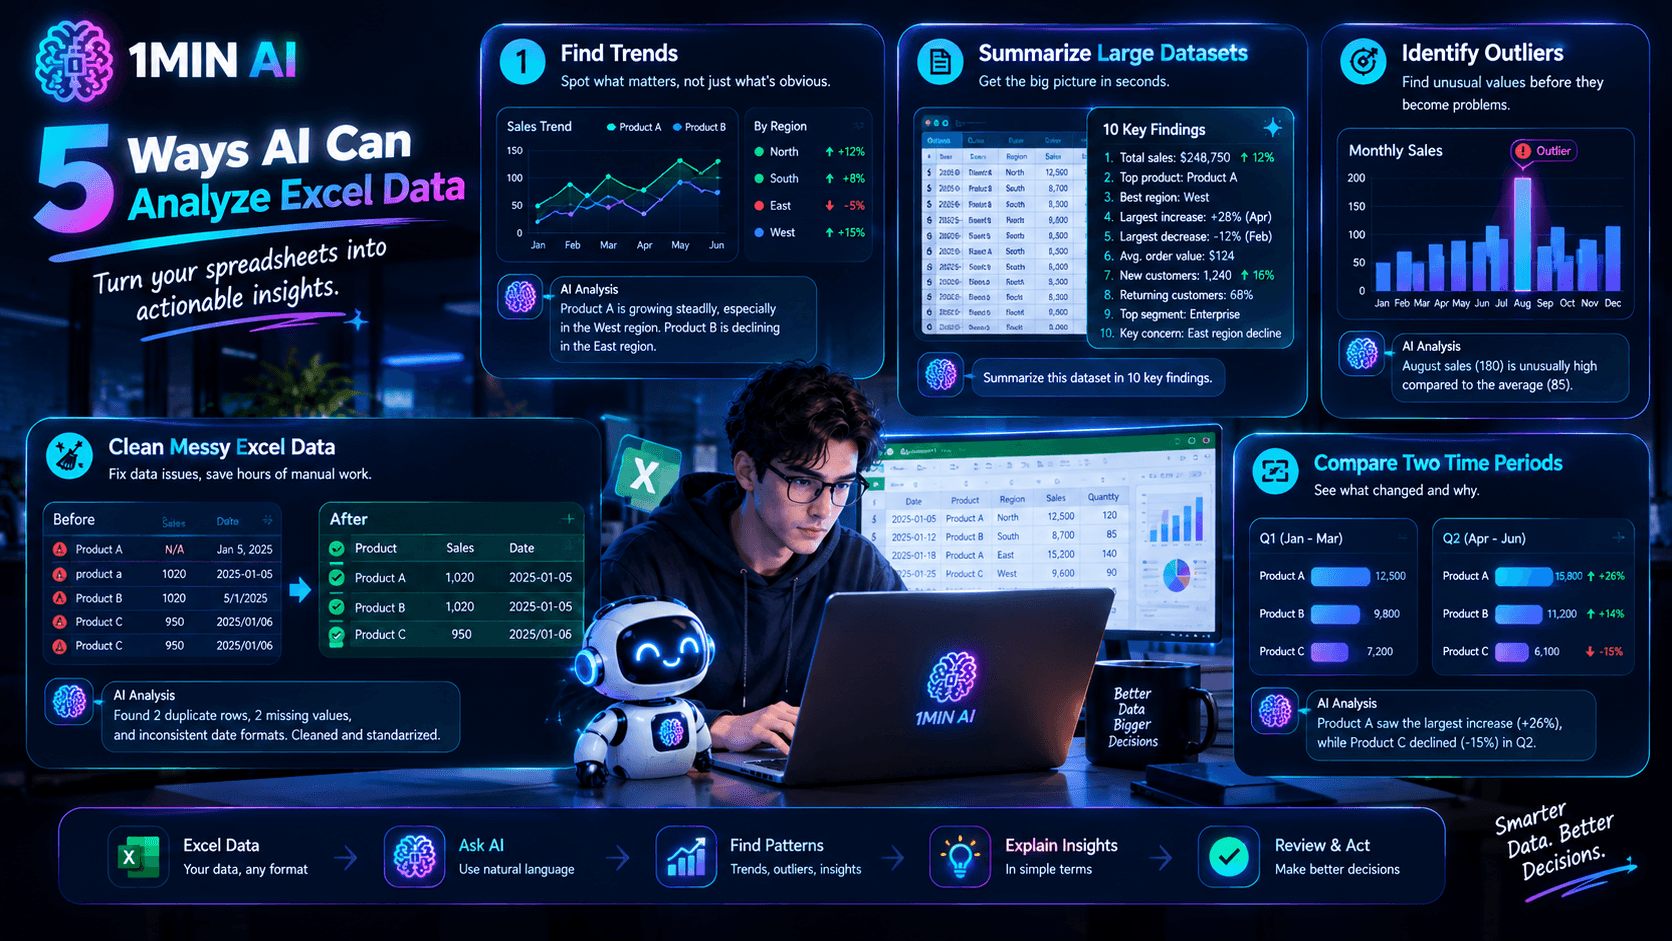
1. Find Trends in Your Excel Data
One of the most useful applications of AI is finding patterns that may not be immediately obvious.
For example, a sales spreadsheet might contain:
- Monthly revenue
- Product names
- Sales representatives
- Regions
- Order quantities
- Customer segments
Rather than manually comparing every column, ask AI to identify the most important trends.
Prompt: Analyze this Excel dataset and identify the most significant trends. Compare performance across months, products, and regions, and explain the findings in simple terms.
AI can then highlight areas worth investigating further.
For example, you might discover that one product category is consistently growing while another is declining.
2. Summarize Large Datasets
Large spreadsheets can be difficult to understand simply because there is too much information.
AI can turn hundreds or thousands of rows into a short summary of the most important findings.
Prompt: Summarize this spreadsheet in 10 key findings. Focus on the most important numbers, patterns, changes, and potential areas of concern.
This can be useful when preparing:
- Management reports
- Client updates
- Sales meetings
- Marketing reviews
- Financial summaries
- Internal presentations
Instead of reading the entire spreadsheet first, you can use AI to create an initial overview and then investigate the relevant areas.
3. Identify Outliers and Unusual Results
An outlier is a value that differs significantly from the rest of the dataset.
For example, you might have a sales report where most monthly orders fall within a relatively consistent range, but one month suddenly shows a very large increase.
AI can help identify these unusual values.
Prompt: Find unusual or potentially anomalous values in this dataset. Explain which rows or categories stand out and why they may require further investigation.
Outliers don't automatically mean something is wrong. They could represent legitimate events, such as a major customer order or seasonal demand.
AI can help you find the unusual results, while you investigate why they occurred.
4. Clean Messy Excel Data
Data cleaning is often one of the most repetitive parts of working with spreadsheets.
Common problems include:
- Duplicate rows
- Missing values
- Inconsistent capitalization
- Different date formats
- Extra spaces
- Inconsistent category names
- Incorrect data types
AI can help identify these problems and suggest ways to resolve them.
Prompt: Review this spreadsheet for data-quality issues. Identify duplicate records, missing values, inconsistent formatting, and inconsistent category names. Explain how each issue should be handled.
You should review suggested changes before applying them, especially when the spreadsheet contains important business information.
5. Compare Two Time Periods
Businesses frequently need to compare performance across different periods.
For example:
- January vs. February
- Q1 vs. Q2
- This year vs. last year
- Before vs. after a campaign
AI can analyze the differences and explain what changed.
Prompt: Compare the sales data from these two periods. Identify the largest increases and decreases by product and region, and explain the most important differences.
This can turn a basic spreadsheet comparison into a more readable business summary.
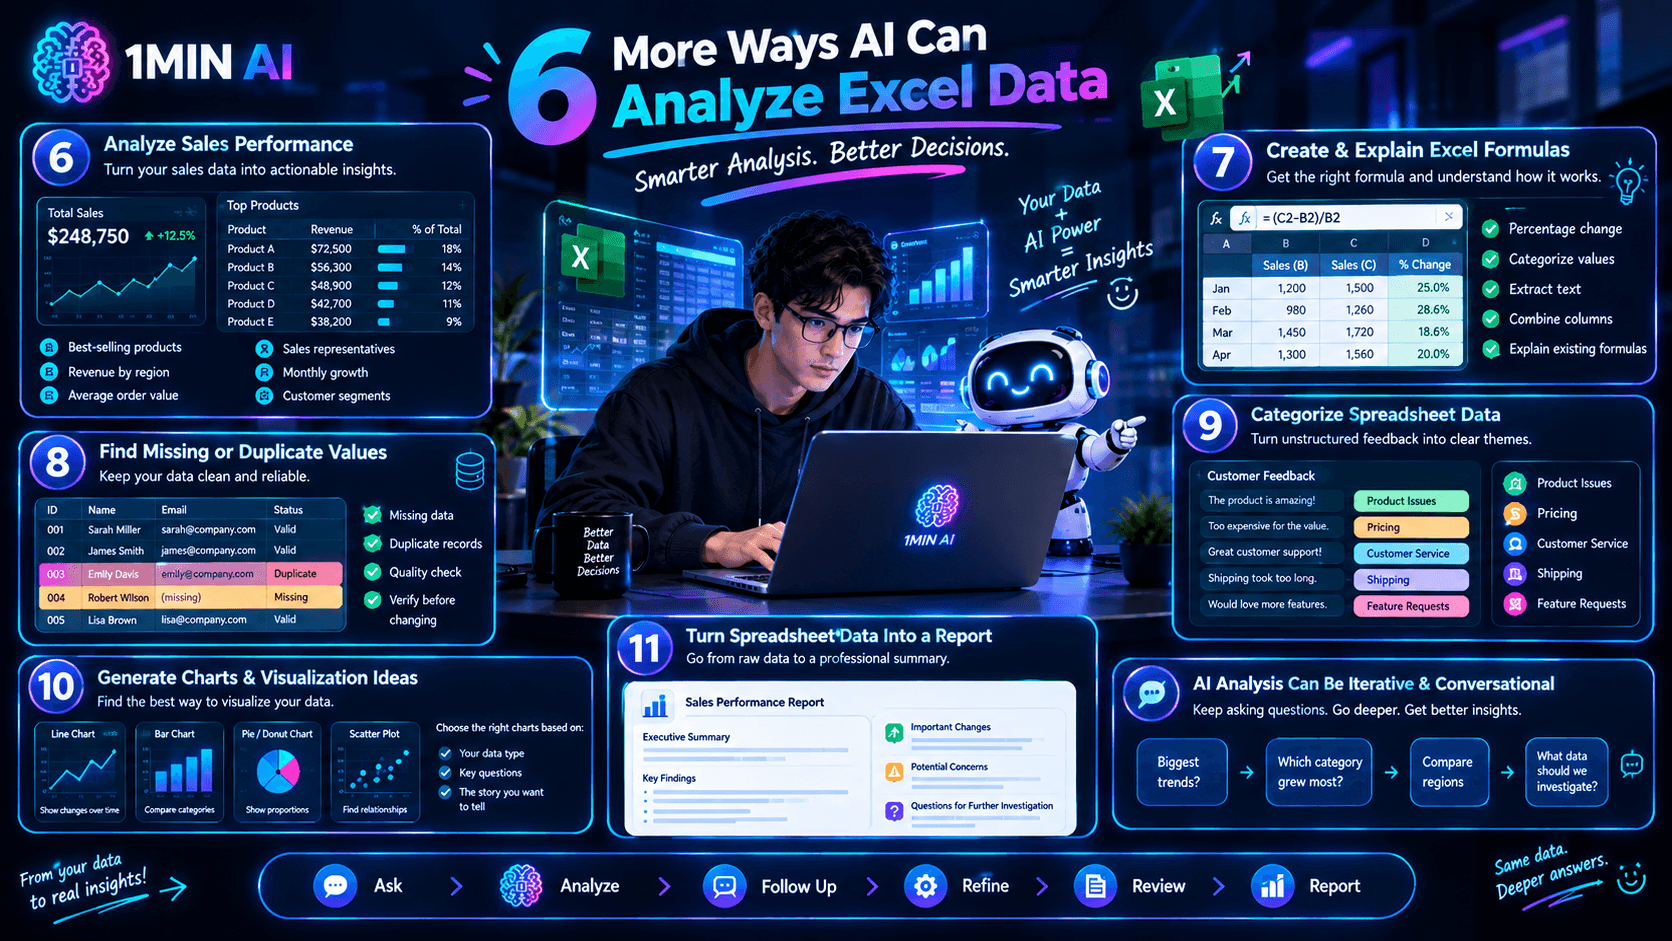
6. Analyze Sales Performance
Sales spreadsheets are particularly suitable for AI analysis.
You can ask questions about:
- Best-selling products
- Revenue by region
- Average order value
- Sales by representative
- Monthly growth
- Customer segments
- Product performance
For example:
Prompt: Analyze this sales spreadsheet and identify the top 10 products by total revenue. Include units sold, revenue, and percentage of total revenue.
You can then ask follow-up questions about the results.
For instance, if one product has high sales volume but relatively low revenue, you can investigate its pricing or margins.
7. Create and Explain Excel Formulas
AI can also help when you know what you want to calculate but don't remember the Excel formula.
For example, you might need to calculate a percentage change, categorize values, extract information from text, or combine data from different columns.
Prompt: I need an Excel formula that calculates the percentage change between the values in columns B and C. Explain the formula and show me how to apply it to the entire column.
This can be particularly useful for people who use Excel regularly but aren't advanced spreadsheet users.
AI can also explain existing formulas.
Prompt: Explain this Excel formula in simple terms. Break down what each function does and describe what result it produces.
8. Find Missing or Duplicate Values
Missing and duplicate data can affect the accuracy of your analysis.
AI can help identify potential issues before you use the spreadsheet for reporting or decision-making.
Prompt: Check this dataset for duplicate records and missing values. Group the findings by column and explain which issues are most important to address.
For larger datasets, this can provide a useful first-pass quality check.
However, always verify important records before deleting or changing them.
9. Categorize Spreadsheet Data
Sometimes a spreadsheet contains information that needs to be grouped into categories.
For example, customer feedback might contain thousands of individual responses that could be categorized into:
- Product issues
- Pricing
- Customer service
- Shipping
- Feature requests
AI can help classify the information.
Prompt: Categorize these customer feedback entries into meaningful groups. Create a category for each major theme and assign every relevant entry to the most appropriate category.
This can make unstructured information easier to analyze.
10. Generate Charts and Visualization Ideas
Numbers are often easier to understand when presented visually.
AI can help determine which types of charts may be appropriate for your dataset.
For example:
- Line charts for changes over time
- Bar charts for category comparisons
- Pie or donut charts for simple proportions
- Scatter plots for relationships between variables
Prompt: Review this dataset and recommend the three most useful charts for explaining the main findings. For each chart, identify the relevant columns and explain what the visualization would show.
You can then create the charts in Excel or another visualization tool.
11. Turn Spreadsheet Data Into a Report
Raw spreadsheet data isn't always suitable for sharing with clients or managers.
AI can transform analysis into a structured summary.
Prompt: Turn the findings from this spreadsheet into a concise business report. Include an executive summary, key findings, important changes, potential concerns, and questions that should be investigated further.
This can save time when turning analysis into a presentation or written report.
Ask Follow-Up Questions Instead of Starting Over
One advantage of using AI for spreadsheet analysis is that you can continue asking questions about the same dataset.
For example:
First prompt: Analyze this sales spreadsheet and identify the biggest trends.
Then:
Follow-up: Which product category contributed most to the revenue increase?
Then:
Follow-up: Compare that category across regions.
Then:
Follow-up: What additional data would help explain this result?
This creates a more interactive analysis process than manually running separate spreadsheet operations for every question.
How to Get Better Results When Using AI With Excel
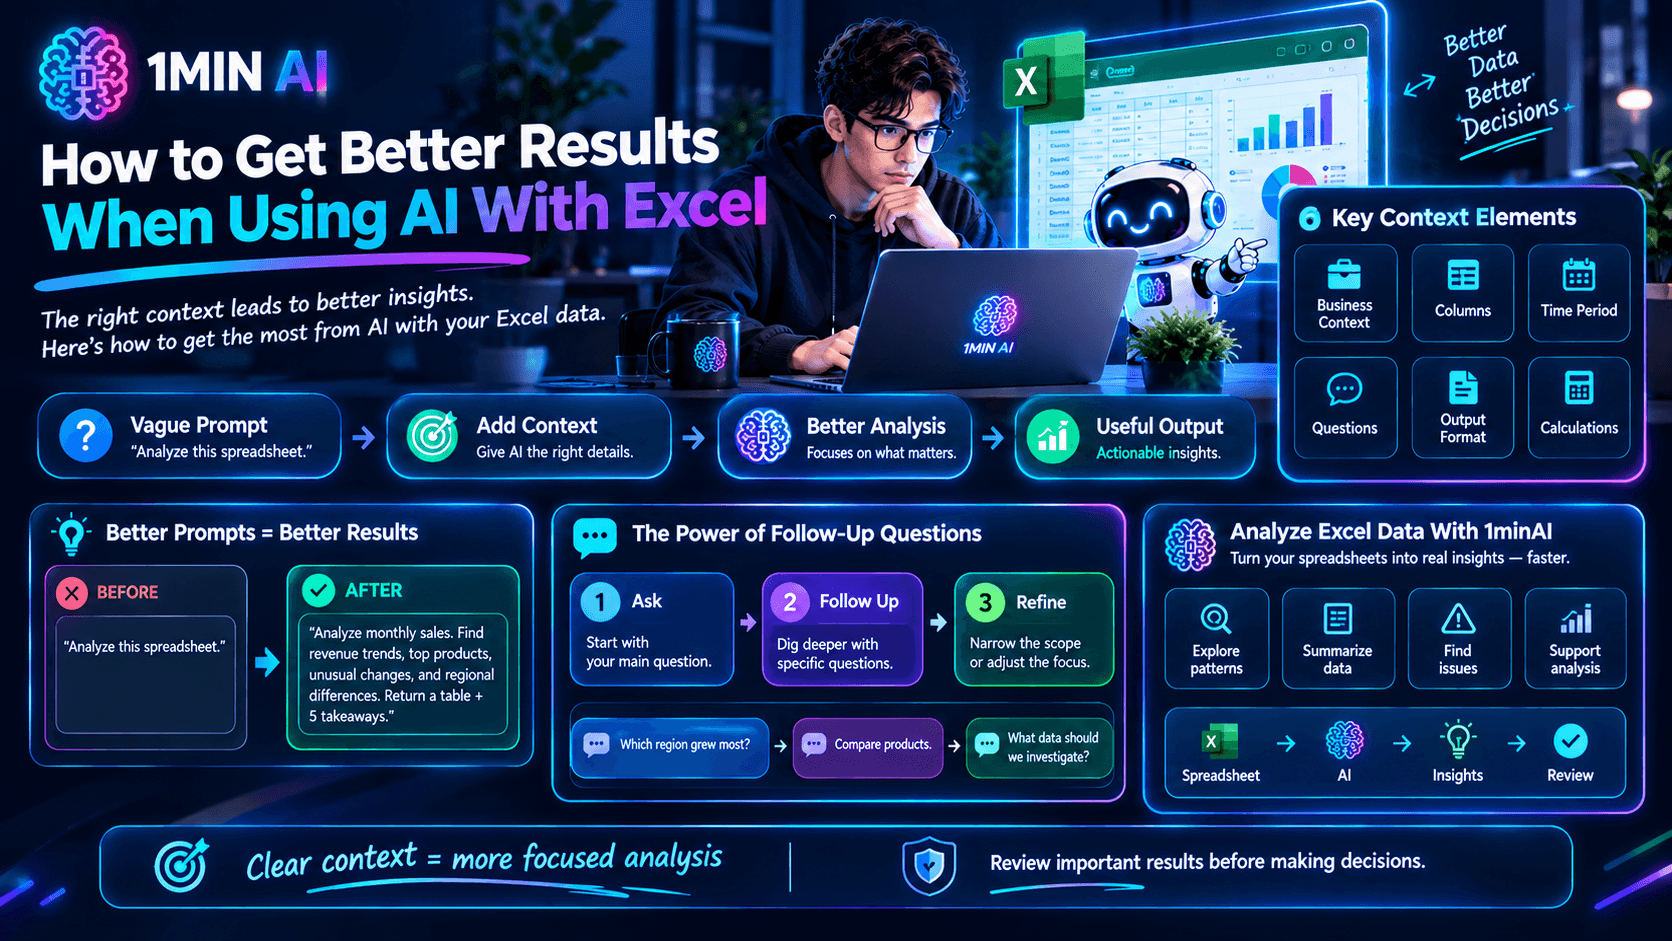
The quality of your analysis depends partly on how clearly you describe what you need.
Instead of asking:
Prompt: Analyze this spreadsheet.
Give the AI more context.
Prompt: Analyze this monthly sales spreadsheet for an ecommerce business. Identify revenue trends, top-performing products, unusual changes, and regional differences. Present the findings as a table followed by five key takeaways.
You can also specify:
- The business context
- The columns that matter
- The time period
- The questions you want answered
- The desired output format
- Any calculations you need
Clear instructions make it easier for AI to focus on the analysis that actually matters.
Analyze Excel Data With 1minAI
1minAI provides an AI spreadsheet analysis workflow that can help you work with spreadsheet data and turn raw information into useful insights.
Instead of manually searching through large datasets for every question, you can use AI to explore patterns, summarize information, identify potential issues, and support your data-analysis workflow.
This can be useful for business owners, marketers, analysts, freelancers, students, and anyone who regularly works with spreadsheet data.
For further information, read here: AI Spreadsheet Analysis
Discover more AI features: https://1min.ai/features
Try 1minAI agent now: https://app.1min.ai/ai-agent-demo
Alternatives
Discover the best alternatives to 1minAI and compare features, pricing, and use cases.

1min.AI vs OpenRouter
1min.AI vs. OpenRouter: Compare the ready-to-use AI creation product against the technical API tool. Find out if you need a zero-code creative studio or a coding infrastructure hub.
 Ngoc Hong
1min.AI vs Taskade
Compare 1min.AI vs Taskade for AI content creation, automation, agents, and creative workflows to find the right workspace.
Ngoc Hong
1min.AI vs Lovart
Compare 1min.AI vs Lovart across features, pricing, credits, brand tools, and use cases to find the right AI platform for your workflow.
Ngoc HongAI Tools
Discover the best AI tools to boost productivity, creativity, and everyday work.
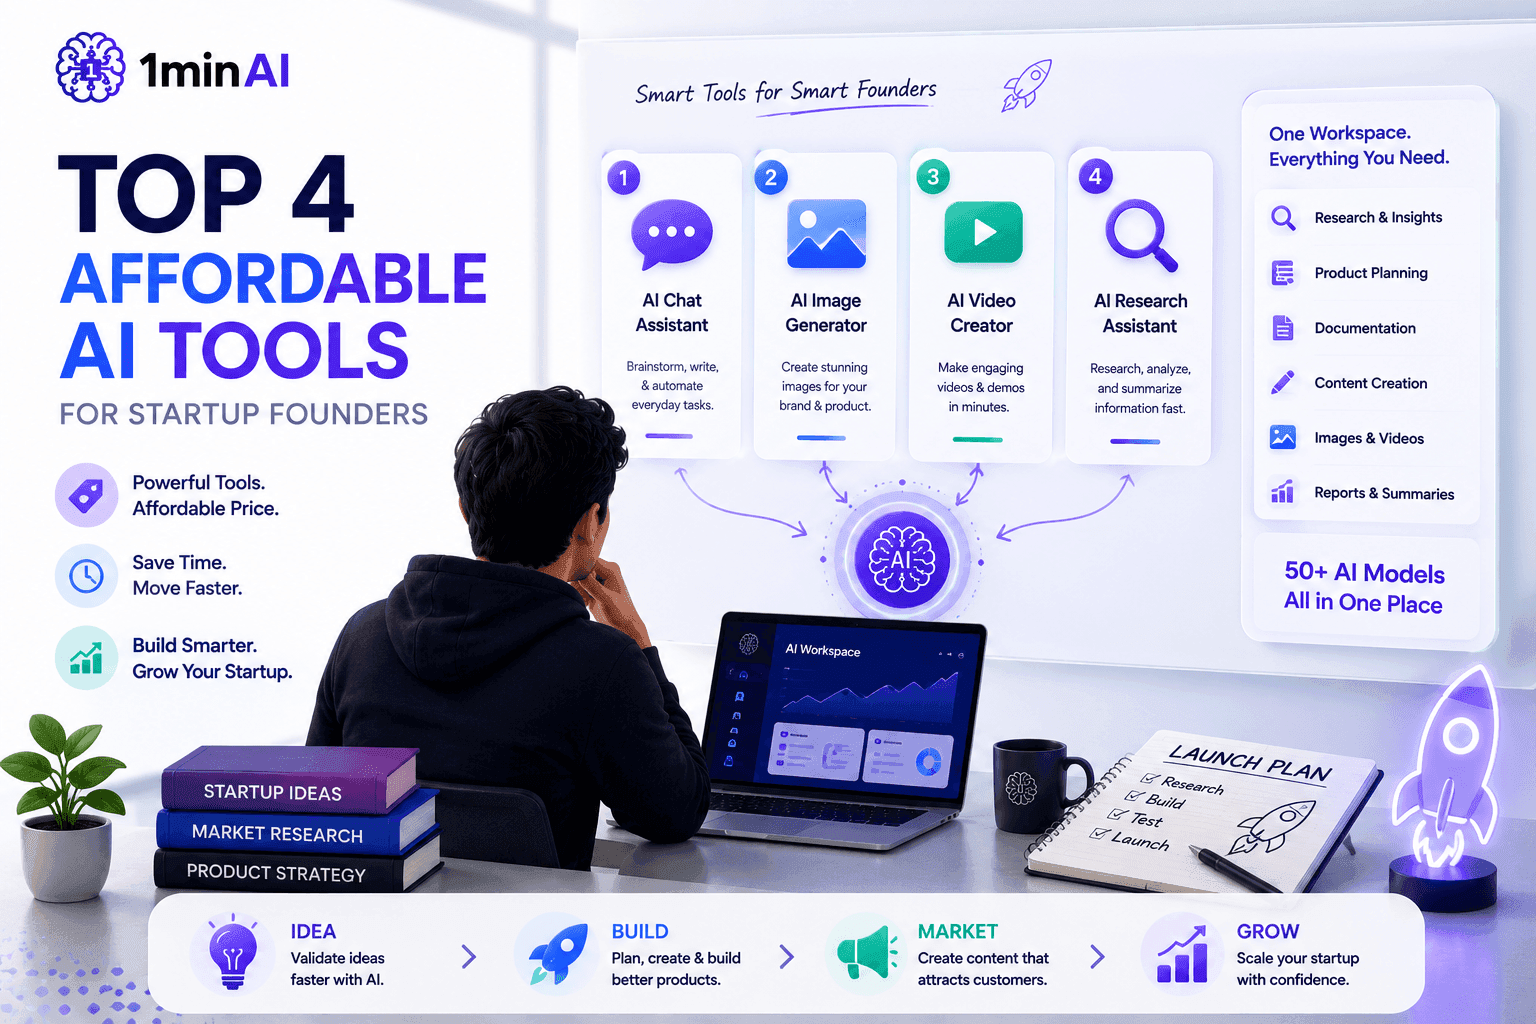
Top 4 Affordable AI Tools for Startup Founders
Discover the top 4 affordable AI tools for startup founders to validate ideas, build products, create content, and launch faster without overspending.
 Tram Ta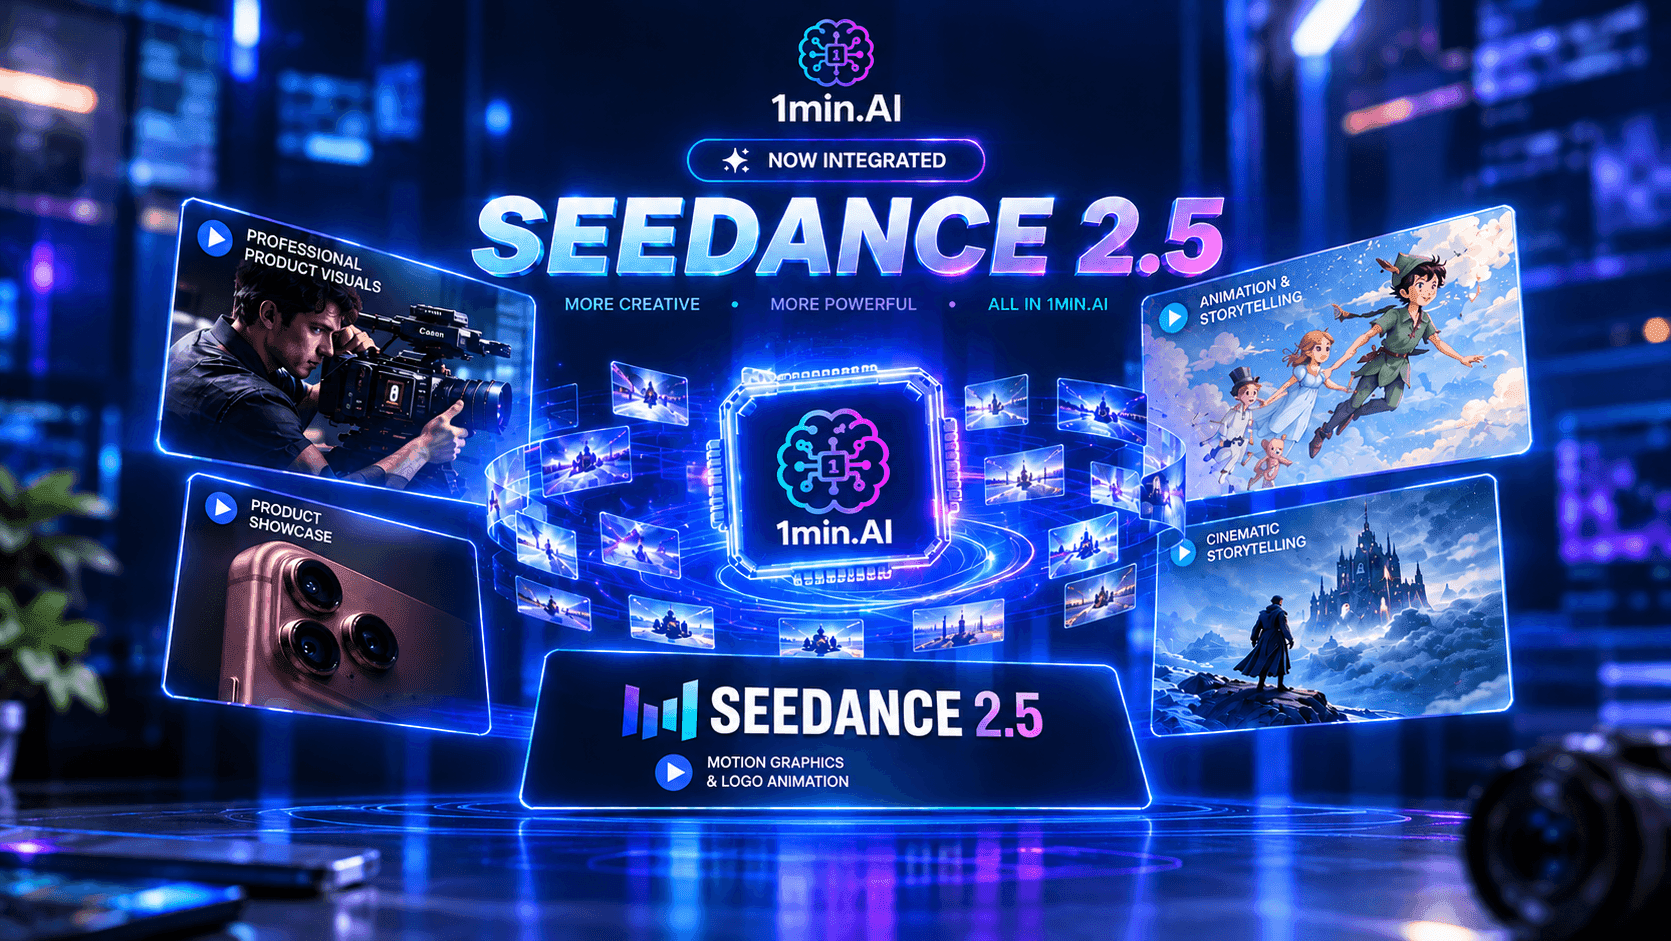
[Seedance 2.5 New] Better AI Product Videos, Less Rework in 1min.AI
Discover how AI image-to-video product consistency helps creators reduce failed generations, save AI credits, and produce more usable commercial and UGC content.
 Lien Anh Vu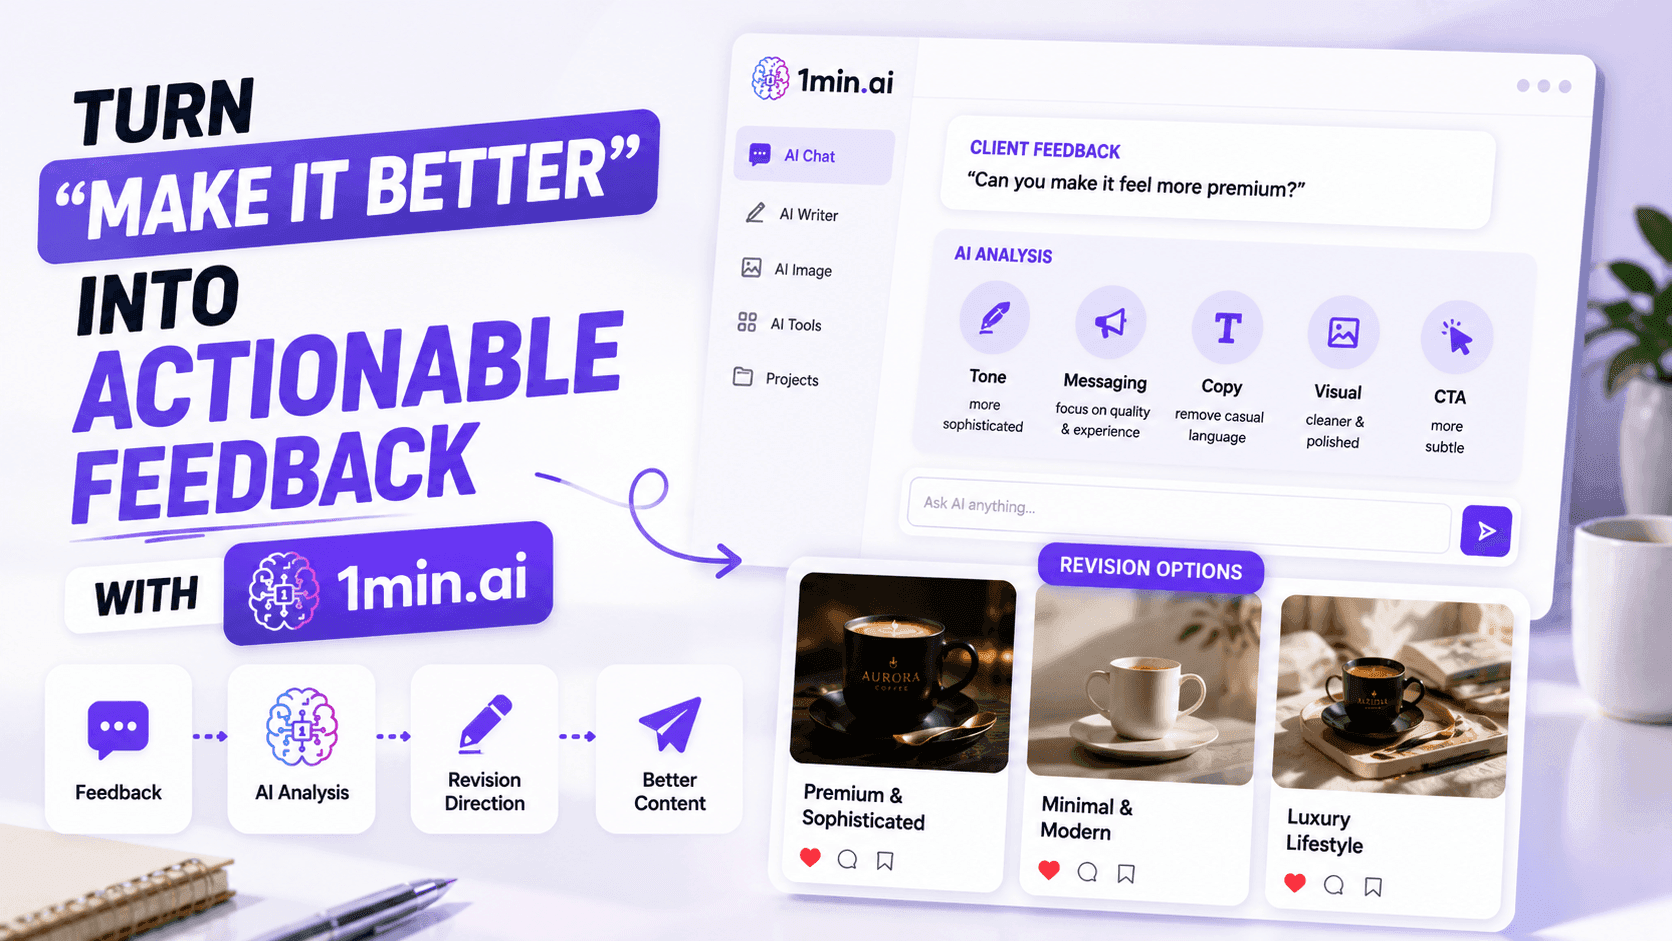
Turn “Make It Better” Into Better Content With AI
Use AI to turn vague client feedback into clear revisions, reduce unnecessary edits, and deliver better content faster.
Lien Anh VuAI Features
Comprehensive AI features that streamline workflows, improve efficiency, and empower teams to achieve more.

One Product, 10 UGC Creatives: How AI Makes Content Testing Easier
Create more authentic UGC with an AI UGC video generator, test more creative angles and scale affiliate content without filming every version.
Lien Anh Vu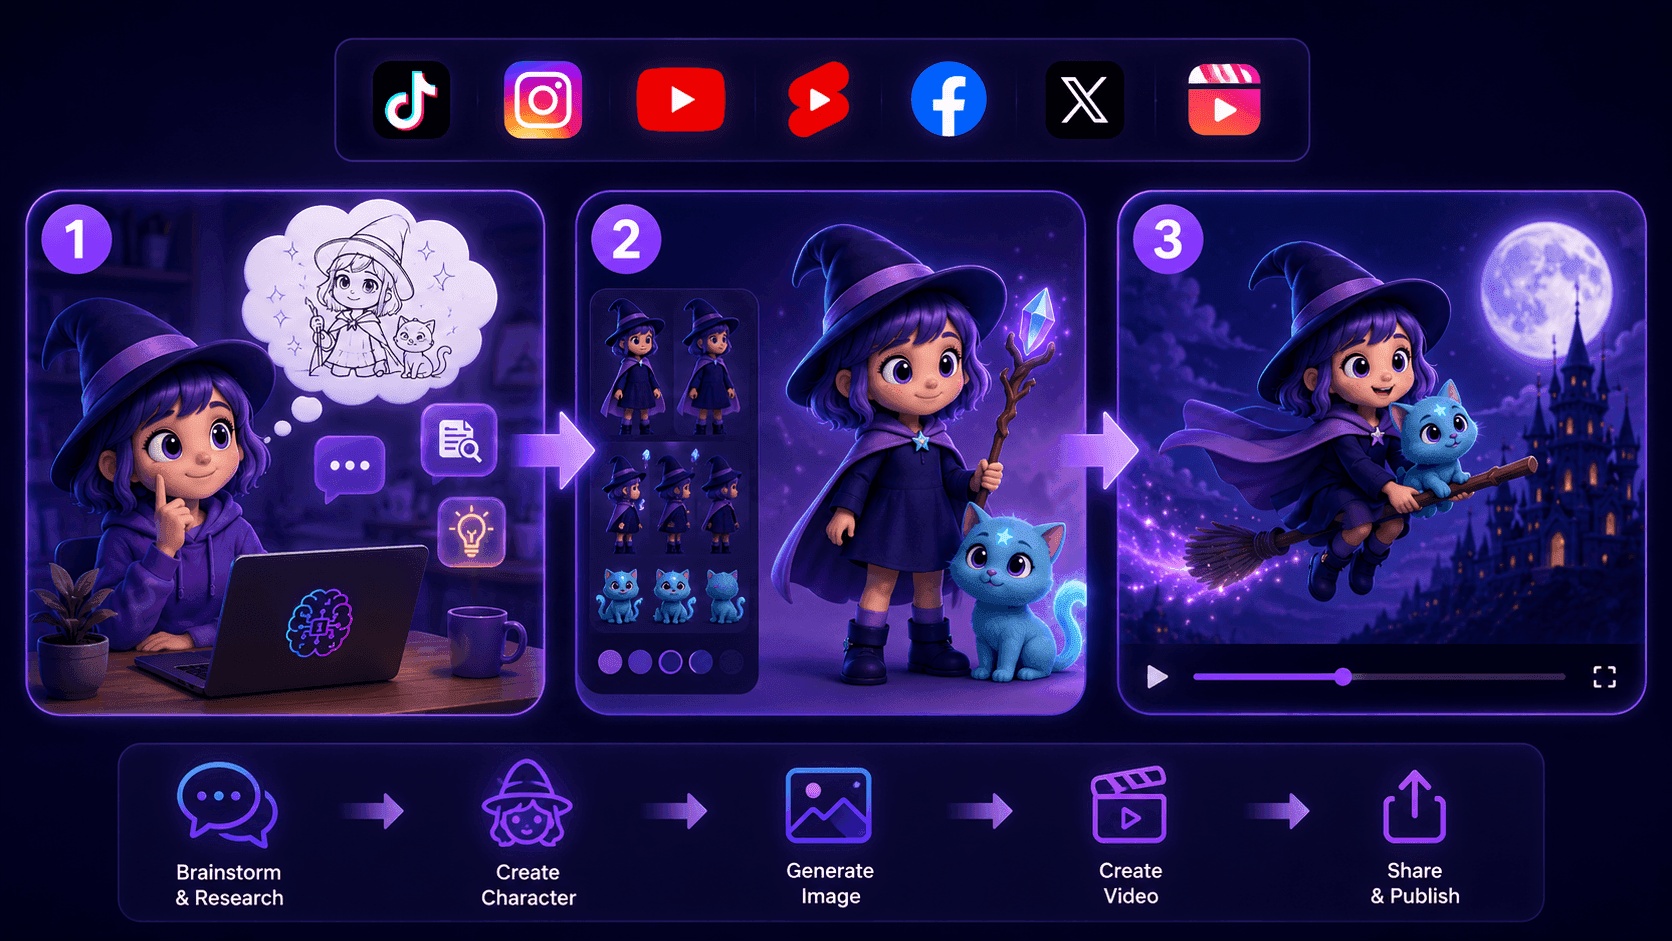
Create Consistent Cartoon Content in Just a Few Steps
Create cartoon videos for TikTok and Reels in 3 simple steps with 1min.AI, from researching ideas to characters and animated videos.
Lien Anh Vu
1minAI: Free AI Grammar Checker
Check grammar for free with 1minAI’s AI grammar checker. Find grammar, spelling, and writing mistakes, improve clarity, and polish your content in seconds.
Tram TaAI Use Cases
A curated collection of AI use cases for business, productivity, and industry-specific applications.
One Product, 10 UGC Creatives: How AI Makes Content Testing Easier
Create more authentic UGC with an AI UGC video generator, test more creative angles and scale affiliate content without filming every version.
Lien Anh Vu
Best Time to Post on Instagram: A Practical Guide for Better Engagement
Discover the best time to post on Instagram, including the best days and times for different audiences, plus tips to find the ideal posting schedule for your account.
Tram Ta
Build a Portfolio Website Faster with 1min.AI
Learn how freelance creatives can use 1min.AI to plan, write, design, and generate a professional portfolio website faster, even without strong coding skills.
Lien Anh VuAI Tutorials
Learn how to use AI with practical, step-by-step tutorials.

Black Friday AI Tool Deals in 2026
Discover what Black Friday AI tool deals 2026 has to offer. Find out how to secure the 1min.AI lifetime deal via AppSumo, Dealify, Stack Social, and verify on Trustpilot, Slashdot, and Software Advice.
 Hang Nguyen
Create Consistent Cartoon Content in Just a Few Steps
Create cartoon videos for TikTok and Reels in 3 simple steps with 1min.AI, from researching ideas to characters and animated videos.
Lien Anh Vu[Seedance 2.5 New] Better AI Product Videos, Less Rework in 1min.AI
Discover how AI image-to-video product consistency helps creators reduce failed generations, save AI credits, and produce more usable commercial and UGC content.
Lien Anh VuAI Guides
Learn AI faster with practical guides, real-world examples, and actionable best practices.

Safely Buy AI Tools Online: 2026 Black Friday Guide
Discover how to find and secure the best Black Friday AI deals online. Learn expert strategies to avoid scams, combat subscription fatigue, and verify software.
Hang NguyenCreate Consistent Cartoon Content in Just a Few Steps
Create cartoon videos for TikTok and Reels in 3 simple steps with 1min.AI, from researching ideas to characters and animated videos.
Lien Anh Vu[Seedance 2.5 New] Better AI Product Videos, Less Rework in 1min.AI
Discover how AI image-to-video product consistency helps creators reduce failed generations, save AI credits, and produce more usable commercial and UGC content.
Lien Anh VuAI Solutions
Browse the best AI solutions for automation, coding, research, productivity, customer support, marketing, and business workflows.

Free AI Tattoo Generator: Custom Designs
Turn any idea into a custom tattoo design with 1min.AI's free AI tattoo generator. Describe your idea, pick a style, and download in seconds.
 Trang Tran
Safely Buy AI Tools Online: 2026 Black Friday Guide
Discover how to find and secure the best Black Friday AI deals online. Learn expert strategies to avoid scams, combat subscription fatigue, and verify software.
Hang Nguyen[Seedance 2.5 New] Better AI Product Videos, Less Rework in 1min.AI
Discover how AI image-to-video product consistency helps creators reduce failed generations, save AI credits, and produce more usable commercial and UGC content.
Lien Anh VuAI Models
Explore the world's leading AI models in one place.
One Product, 10 UGC Creatives: How AI Makes Content Testing Easier
Create more authentic UGC with an AI UGC video generator, test more creative angles and scale affiliate content without filming every version.
Lien Anh VuCreate Consistent Cartoon Content in Just a Few Steps
Create cartoon videos for TikTok and Reels in 3 simple steps with 1min.AI, from researching ideas to characters and animated videos.
Lien Anh Vu[Seedance 2.5 New] Better AI Product Videos, Less Rework in 1min.AI
Discover how AI image-to-video product consistency helps creators reduce failed generations, save AI credits, and produce more usable commercial and UGC content.
Lien Anh VuAI Comparisons
Compare AI tools, models, and platforms to find the best fit for your needs.

Kling AI Vs Veo 3: Which Model Wins?
Kling AI vs Veo 3: compare motion, native audio, pricing & free tiers to see which AI video generator wins for your project - try both on 1min.AI.
Trang Tran[Seedance 2.5 New] Better AI Product Videos, Less Rework in 1min.AI
Discover how AI image-to-video product consistency helps creators reduce failed generations, save AI credits, and produce more usable commercial and UGC content.
Lien Anh Vu
DeepSeek V4 Pro vs Flash Comparison
Compare DeepSeek V4 Pro vs DeepSeek V4 Flash metrics. Optimize your agentic apps and improve AI fact checking on 1min.ai today.
Ngoc HongAI Integrations
Seamlessly integrate AI with the tools you already use to automate work and boost productivity.
POV: You Have 10+ Posts to Make Every Day
Learn how to build an AI content workflow that helps content creators produce 10+ social media posts a day faster with AI brainstorming, image generation, and content creation.
Lien Anh Vu
How to Use an AI Fashion Video Generator for Fashion Week 2026
Turn Fashion Week 2026 ideas into stunning fashion videos with AI. Learn how to brainstorm, create visuals, and transform images into videos with one simple workflow.
Lien Anh Vu
Stop Switching Between AI Apps: How AI Integration Transforms Employer Branding
Discover how AI integration helps HR teams streamline employer branding by combining AI writing, documents, images, video, and multiple AI models into one workspace.
Tram TaAI for Industries
Find the best AI tools and workflows for healthcare, finance, education, legal, manufacturing, retail, real estate, and more

Free AI Real Estate Video Generator
Turn listing photos into narrated property videos with AI real estate video tools. See how 1min.AI creates walkthroughs, voiceovers & captions in minutes.
Trang Tran
Free AI Virtual Staging: Furnish Any Room
Stage any real estate listing with AI virtual staging: upload a photo, pick a style, and get a photorealistic furnished room in seconds, free to try.
Trang Tran
The Problem With AI Design? It Looks Too AI
AI-generated designs can look polished but still feel artificial. Here are 5 prompt techniques designers can use to create more realistic, intentional visuals.
Lien Anh VuAI Agents
Discover and run AI agents to automate tasks across your work and daily life.
1minAI: Free AI Grammar Checker
Check grammar for free with 1minAI’s AI grammar checker. Find grammar, spelling, and writing mistakes, improve clarity, and polish your content in seconds.
Tram Ta
AI Agents for Facebook
Use an AI Agent for Facebook to create content, generate images, schedule posts, and publish from your documents and conversations.
Ngoc Hong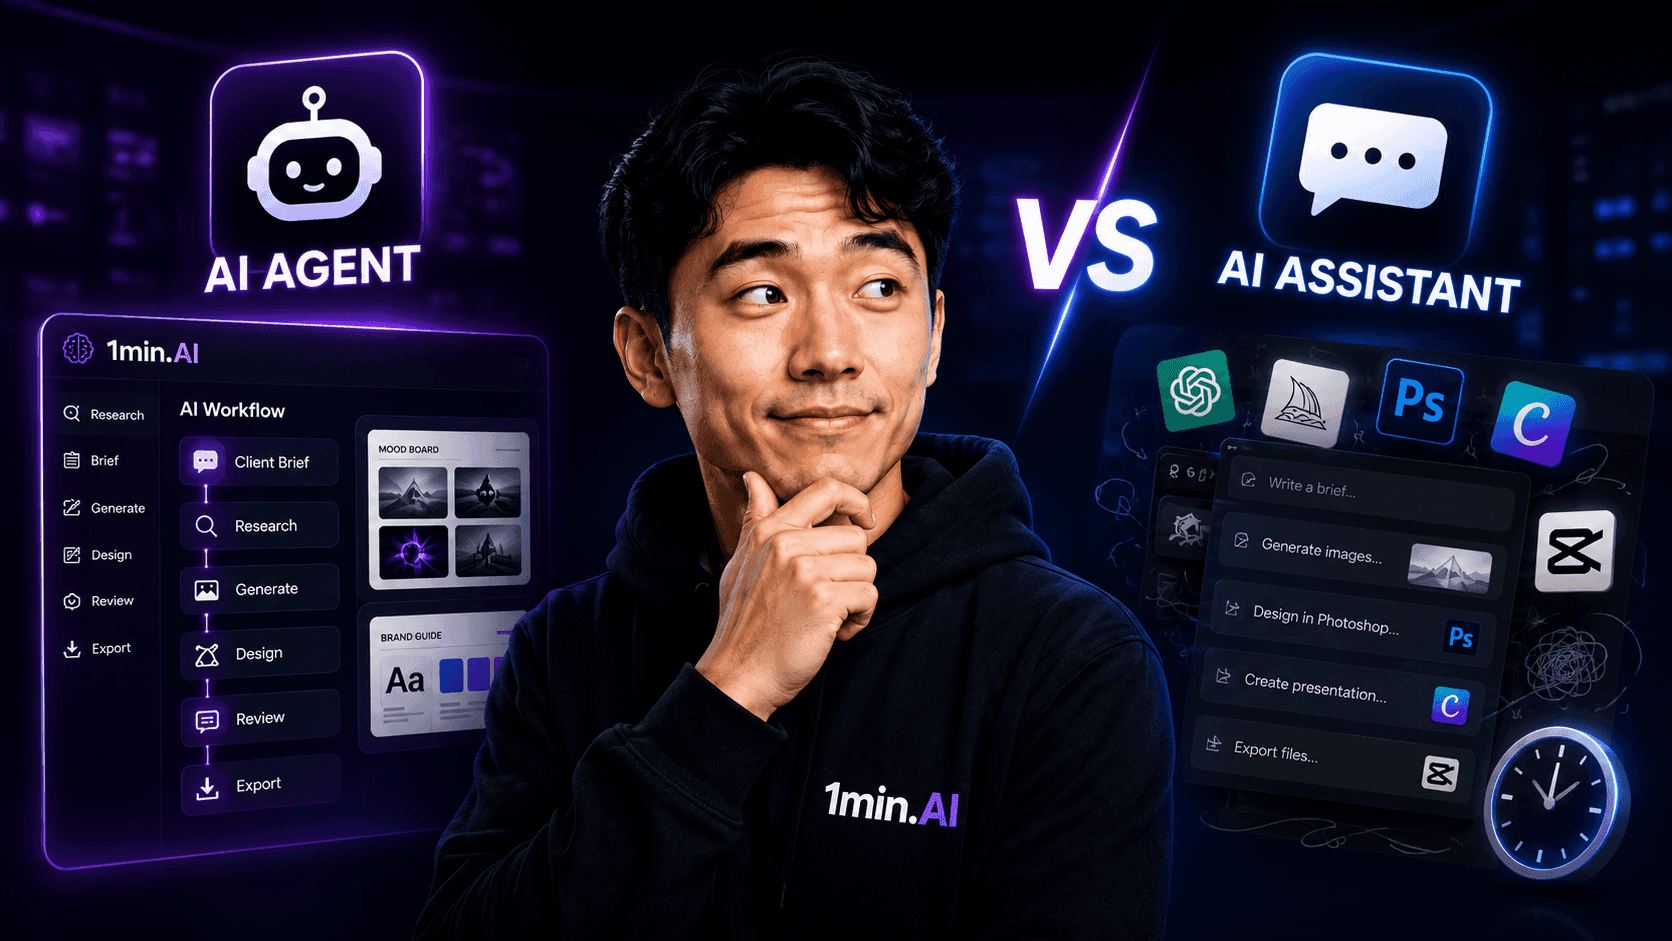
AI Agent vs AI Assistant: Which One Actually Saves Designers More Time?
Learn the difference between AI Agent vs AI Assistant and discover which solution helps designers automate repetitive work, reduce revisions, and save more time.
Lien Anh VuAI Workflows
Explore ready-to-use AI workflows for productivity, marketing, sales, support, and more.
Create Consistent Cartoon Content in Just a Few Steps
Create cartoon videos for TikTok and Reels in 3 simple steps with 1min.AI, from researching ideas to characters and animated videos.
Lien Anh VuPOV: You Have 10+ Posts to Make Every Day
Learn how to build an AI content workflow that helps content creators produce 10+ social media posts a day faster with AI brainstorming, image generation, and content creation.
Lien Anh VuHow to Use an AI Fashion Video Generator for Fashion Week 2026
Turn Fashion Week 2026 ideas into stunning fashion videos with AI. Learn how to brainstorm, create visuals, and transform images into videos with one simple workflow.
Lien Anh VuNewsletter
Weekly AI Innovations with 1minAI

🔮 Weekly AI Innovations #137: ElevenLabs Music & AI social Profile Control
The newest 1min.ai updates deliver professional music generation and highly requested privacy tools. Dive into a seamless workflow today!
Hang Nguyen
🔮 Weekly AI Innovations #136: Grok 4.6 and Smart Data Retention
Discover the latest 1min.ai updates! Upgrade to Grok 4.6 for blazing-fast AI, and check our new Data Retention policies to secure your files today.
Hang Nguyen
🔮 Weekly AI Innovations #135: Claude Opus 5 and new AI Social Features
Experience the powerful Claude Opus 5 model, and explore new AI Social features like User Pages and Following creators.
Hang Nguyen